Case Studies
ERCOT | December 2024
Looking back to storage asset operations and performance outcomes from December 2024.
December 2024 was a generally uneventful month in ERCOT. On average, storage assets made $1.18/kW, and captured 33% percent of the RT TB2. There was only one notable pricing event, which lasted for just one interval on the evening of December 14th. Nine percent of all battery revenue made throughout the month came from Real-Time Energy on this day.
Across the fleet, 47% of all revenue ($/kW) was made in Real-Time Energy.
While the top 10 revenue generators made 81% of their total revenue from RT energy, the story isn’t so cut and dry. These assets only captured, on average, 51% of the RT TB2 – meaning they left a significant amount of the available revenue opportunity on the table.
There were also two outliers that generated ~2x the revenue of other high performing assets – but only captured 25% and 28% of their RT TB2s respectively. This implies that those two assets benefitted from exceptionally high nodal volatility, which resulted in ‘right place, right time’ revenue rather than true operating effectiveness.
More on benchmarking performance >>
If we remove those two batteries from the sample, only 55% of the revenue from the top 10 assets came from RT and the percent of RT TB2 captured jumps to ~56%.
*Note: RT TB2 does not account for outages and assumes one cycle per day
When we look at the assets that operated best, as defined by capturing the highest percent of available opportunity (percent of TB2 captured), we see that more balanced strategies – incorporating Day-Ahead Energy (DA) and Ancillary Services (AS) actually performed better.
What can we take away from this?
In low volatility months, it is paramount to develop operating strategies tailored to the day, and balance across all products.
If your entire strategy is premised on waiting for a RT energy price spike, you will leave money on the table. This approach is asking to hit a home run every at bat and neglects that a couple base hits, you can still score runs. Plan for the day ahead of you, and execute a unique game plan in order to win.
In quieter months, being at a more volatile node has a more pronounced impact.
With fewer high-priced intervals, capturing even one or two price spikes at a volatile node significantly boosts total revenue relative to the rest of the fleet. Those two high-revenue grossing assets benefited from RT TB2s of ~$25 and $20/kW respectively. That is ~7x higher than the average RT TB2.
Operating Strategy Deep Dive
The top two performing assets – by total revenue and percent of RT TB2 captured – in the North Load Zone (LZ), demonstrate that a more balanced operating approach was superior this month.
In this lower volatility month, the difference between good and great was not hitting the RT energy spike (which the second best asset did) – it was accumulating revenue consistently throughout the month.
-
Asset #1
Consistently balanced all available products
-
Asset #2
Primarily relied on Real-Time Energy revenue
High Revenue Day Deep Dive | December 14, 2024
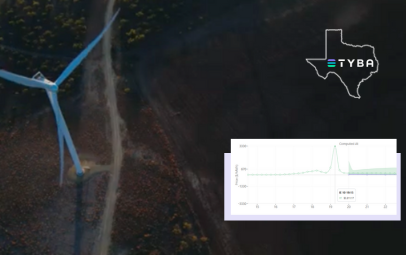
Across ERCOT, there was one day in December when prices hit $4.5K – and only for a single five minute interval. Considering the market price cap is $5,000, hitting that level is exceptionally rare.
As solar was ramping down in the early evening, lower than expected wind resulted in a steep decline in capacity available to SCED (~1.3GW at 17:30). PRC was also below 7GW from 5:15-5:35 pm, resulting in the ORDC adder kicking in. As net load converged, prices shot up, the BESS fleet peaked with ~4.2GW discharging. This resulted in oversupply – so prices promptly dropped and Reg Down was deployed to stabilize frequency.
Staying with the North LZ we can see that, unsurprisingly, the asset that hit the RT price spike saw the best revenue outcomes by a strong margin.
The North LZ’s second best performing asset for the month hit the spike.
- The ESR had committed to very few AS obligations – just a few non-spin commitments, which left them the flexibility to be in the RT market.
- When prices suddenly spiked, they were discharging at max capacity.
- Ended the day with $0.47/kW, which accounts for for more than a quarter of Asset #2’s monthly revenue.
Comparatively:
- The top performing asset overall had committed to DA energy during the 5-6pm interval so was unable to capture upside from the RT energy spike.
- The LZ’s median performers had almost entirely obligated their capacity to AS products so were also inhibited from participating in the RT energy spike.
What can we learn from December performance?
- On days with an exceptionally high RT energy spike, it is pretty cut and dry. If you hit the spike, you did well.
- But over longer periods of time? Hitting the big moments is important – but not everything – and operators shouldn’t discount the other 30 seemingly mundane days.
-

Case Studies
November 2024 Performance | ERCOT
02/24/25
-

Guides
Benchmarking Energy Storage Performance in ERCOT: What Good Looks Like
02/24/25
-

Guides
Impact of Energy Storage on ERCOT’s Peak Winter Demand
01/29/25
-

Case Studies
Maximizing Revenue in ERCOT’s West Load Zone
12/31/24
-
Case Studies
ERCOT: Breaking down the November 10th price spike
11/14/24