New York is on the path to grid decarbonization.
On June 20, 2024, the New York State Public Service Commission approved a roadmap for the state’s grid to be run on 70% renewables, and deploy 6GW of energy storage by 2030. This plan signifies a major vote of confidence in storage’s ability to support a reliable grid transition. It both acknowledges the necessity of storage, and establishes financial incentives that encourage developers to prioritize storage additions.
-
70%
State’s electricity from renewablesby 2030
-
6GW
Energy storage deployedby 2030
-
40%
Reduction in greenhouse gas emissionsby 2030
Incentivizing utility-scale storage
As of today, 1.3GW is already procured or under contract. Of the remaining 4.7GW, 3GW will be utility-scale bulk storage, procured through the Index Storage Credit (ISC) mechanism.
Tyba broke down ISC in March 2023 – review the blog here!
Value-based incentives for Distributed Energy Resources (DERs):
Another 1.5GW will come from retail storage and are being incentivized through programs like Value of Distributed Energy Resources (VDER). This mechanism rewards clean energy delivered to the grid, and is specifically designed to incentivize assets <5MW to support the grid in times and locations that demand is highest.
Bill credits awarded under the VDER program can significantly increase the value of operating storage assets in NY. However, VDER credits are calculated based on multiple value stack components and rates, and vary by technology, utility, and location. This can make project modeling and evaluation difficult for developers – despite being critical to inform investment decisions.
VDER Overview
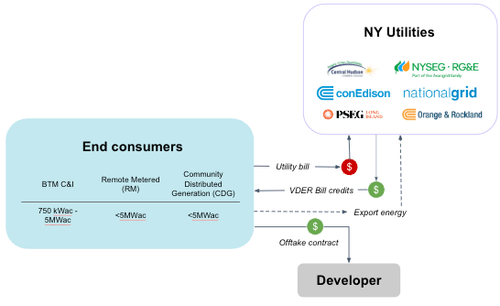
NY VDER was launched in 2017 to incentivize the development of DERs able to firm the grid, and help utilities delay or avoid costly distribution system upgrades. The compensation mechanism credits electricity generation assets based on how much they reduce grid load in high congestion periods and locations.
- Eligible assets include BTM C&I 0.75-5 MWac , FTM Remote Metered <5 MWac, FTM Community Distributed Generation <5MWac.
- Value is awarded in the form of a bill credit from the utility, offsetting the cost of the owner or lessee’s electric bill.
- Value is calculated based on a framework called the “Value Stack,” which takes into account multiple factors that vary based on DER type.
How credits are calculated
The value of the credit is calculated based on a Value Stack Methodology. The components factored in include:
-
Energy Value (LBMP)
The wholesale price of electricity (kWh) based on NYISO’s Day Ahead rate for the relevant zone.
-
Capacity Value (ICAP)
The contribution of energy during demand peaks. There are two options that PV-only and hybrid facilities can chose from to calculate this value:
- Alt 1: Monthly capacity rate x exported energy in all hours
- Alt 2: Annual capacity rate x exported energy during summer peak hours (2-7pm on non-holiday weekdays from 6/24-8/3)
Standalone storage assets, on the other hand, calculate based on:
- Alt 3: Monthly capacity rate x exported energy during NYISO’s peak hour of the year (determined retrospectively).
This makes it imperative for standalone storage operators to forecast and discharge into the annual peak.
Capacity rates are tied to the NYISO wholesale capacity market, and can vary by territory even within a utility. In order to make an informed decision about where to develop or add storage, and which alt to select, companies may want to simulate the credit values across all possible territories.
To demonstrate the concept, let’s play out an example for a hybrid facility, looking at just two territories and see how Alt 1 and Alt 2 compare:

-
Demand Reduction Value (DRV)
Aims to value how much a DER reduces the overall demand on the grid during peak periods, thereby reducing the need for future grid upgrades. DRV windows and rates vary by utility, meaning developers will need to account for the unique rates of each to make an informed investment decision. Let’s look again at a fairly simple example of the same two utilities to show how these rates can vary:

-
Locational System Relief Value (LSRV)
Credited to DERs based on dispatch during at least 10 peak-period calls per year. This credit was designed to incentivize development in specific locations where there are known grid constraints, and the asset can therefore help the utility defer or avoid costly upgrades.
-
Environmental Value (E)
A value that is set by NY-ISO and locked for 25 years. This credit represents the environmental benefit a clean kWh brings to the grid. This is only applicable for PV-only and hybrid projects as it requires no grid charging.
-
Community Credit
A value that is set by each utility and locked for 25 years. This credit aims to encourage the development of Community Distributed Generation projects (CDGs) and is only applicable for PV-only and Hybrid projects.
Together, these components form the value stack. We have been looking at a fairly simple, illustrative example that only compares hybrid facilities across two utilities, and uses average prices from 2023 – but the need to deeply understand the value of these credits is clear.

Scale project simulations to maximize the value of VDER
Developers evaluating standalone storage opportunities, or assessing the value of adding storage to an existing project, will discover optimal project investments when they simulate returns for every available configuration.
Tyba unlocks a developer’s ability to run these simulations at scale. Our flexible platform enables teams to model revenue outcomes with varied locations, price assumptions, asset configurations, ICAP alts, and more.
Optimize revenue during asset operations
Once you’ve landed on the optimal project design and assets go live, operating such that you optimize for the LBMP, ICAP peaks based on the Alt selected, DRV and LSRV values will be critical to maximizing returns.
Keys to operating success include:
- An optimizer able to factor in VDER credit values and applicable time frames so it accounts for all factors when developing strategy and managing state of charge. some text
- Often, DRV windows will align with high LBMP prices – and LSRV peaks occur within these timeframes. Operators can capitalize on the confluence of opportunity if executed correctly.
- Accurate forecasting of the system peaks so assets are able to discharge into the monthly and/or annual peak and capitalize on high LSRV multipliers.
Tyba can help support end-to-end, from using our project simulation module to compare project options and configurations at scale, through live operations where owners can leverage our forecasts and real time optimization to ensure they maximize credits.